Earthquakes on the ShakeMap
The ground vibrates, glasses clink, and ceiling lamps swing. Following the initial surprise, one wonders what has just happened. You can find out whether an earthquake was the cause of the shaking within minutes from our website.
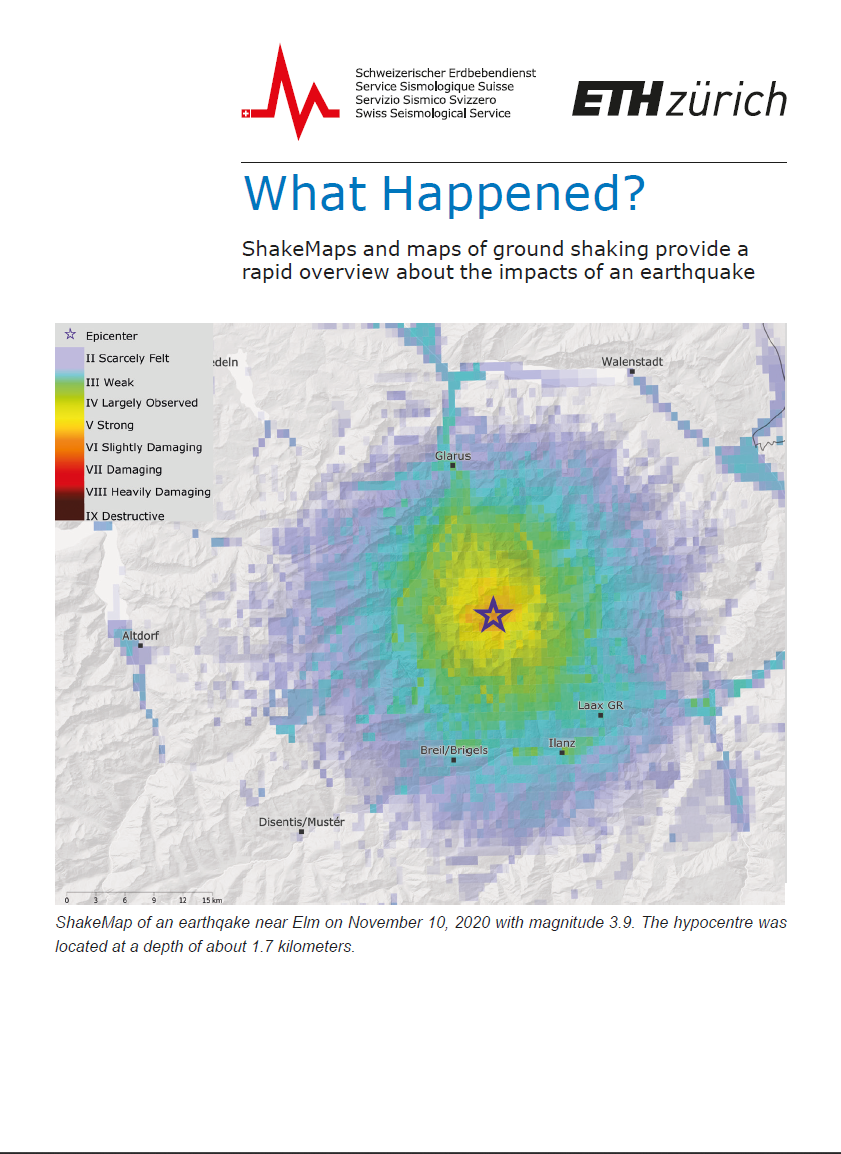
For every earthquake with a magnitude of 2.5 or greater, the Swiss Seismological Service (SED) publishes both a map of ground shaking and a ShakeMap. These provide an overview of the ground motion and associated impacts that can be expected from the earthquake. ShakeMaps provide considerably more information than standard earthquake maps, which typically show only the epicenter and the magnitude. The additional details are useful both to those affected by the ground shaking and to rescue workers who can use the maps as basis for further action.
ShakeMap of an earthqake near Elm on November 10, 2020 with magnitude 3.9. The hypocentre was located at a depth of about 1.7 kilometers.
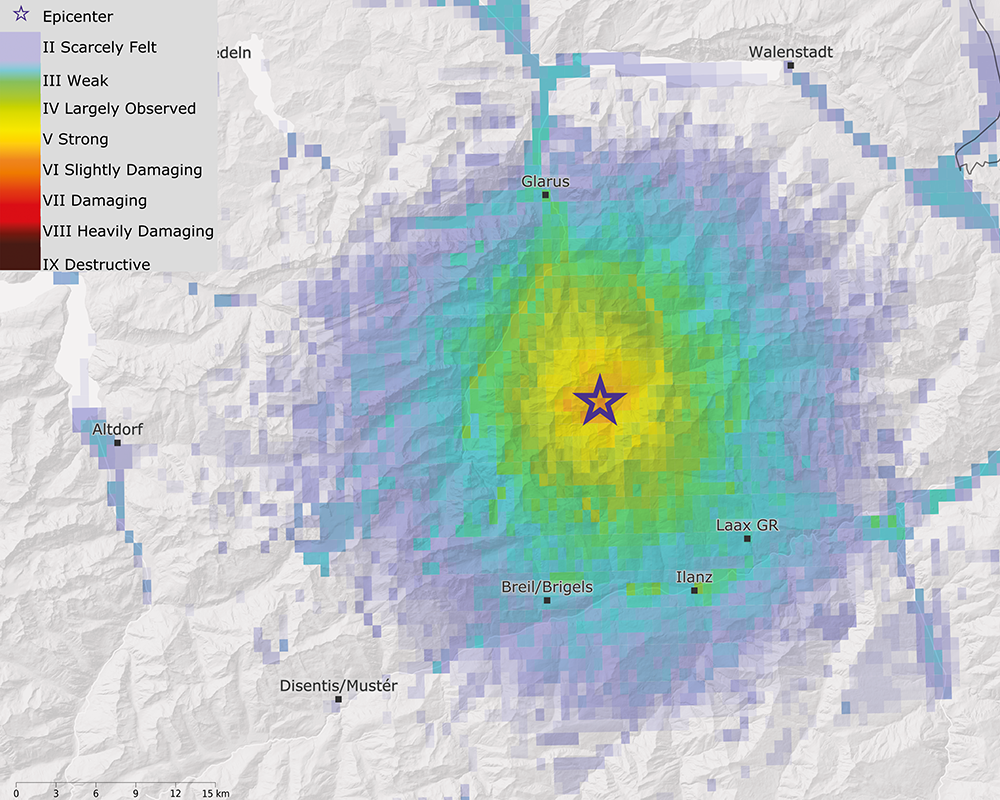
Strong earthquakes cause a great deal of human suffering and enormous damage to buildings and other infrastructure. Immediately following a large earthquake, it is difficult to gain an overview of the situation in order to facilitate initiation of the appropriate measures. ShakeMaps support crisis management during this phase by indicating which areas are especially hard hit. They thereby help authorities and rescue workers target deployment of their resources and serve as a useful source of information. They show where and how intensely the earthquake was felt, as well as whether damage is to be expected. ShakeMaps originated in Southern California and are now used routinely in many earthquake-prone countries.
The creation of a ShakeMap involves several processing steps: First, the epicenter and magnitude of the earthquake are determined from the real-time data recorded by Switzerland’s broadband seismic stations. This information is then combined with the observed maximum ground accelerations at the stations of the strong motion network and with values of the ground shaking based on historical measurements. Before the data is processed to determine macroseismic intensity (EMS-98), it is necessary to filter out local amplification effects. The models that are necessary for calculating ShakeMaps were calibrated especially for Switzerland.
a
A ShakeMap shows the ground shaking that can be expected by an earthquake at every point in Switzerland. The data recorded by real-time seismometers is transmitted to the Swiss Seismological Service in Zurich. There, the data is analyzed and following an earthquake, a ShakeMap is created within approximately five minutes.
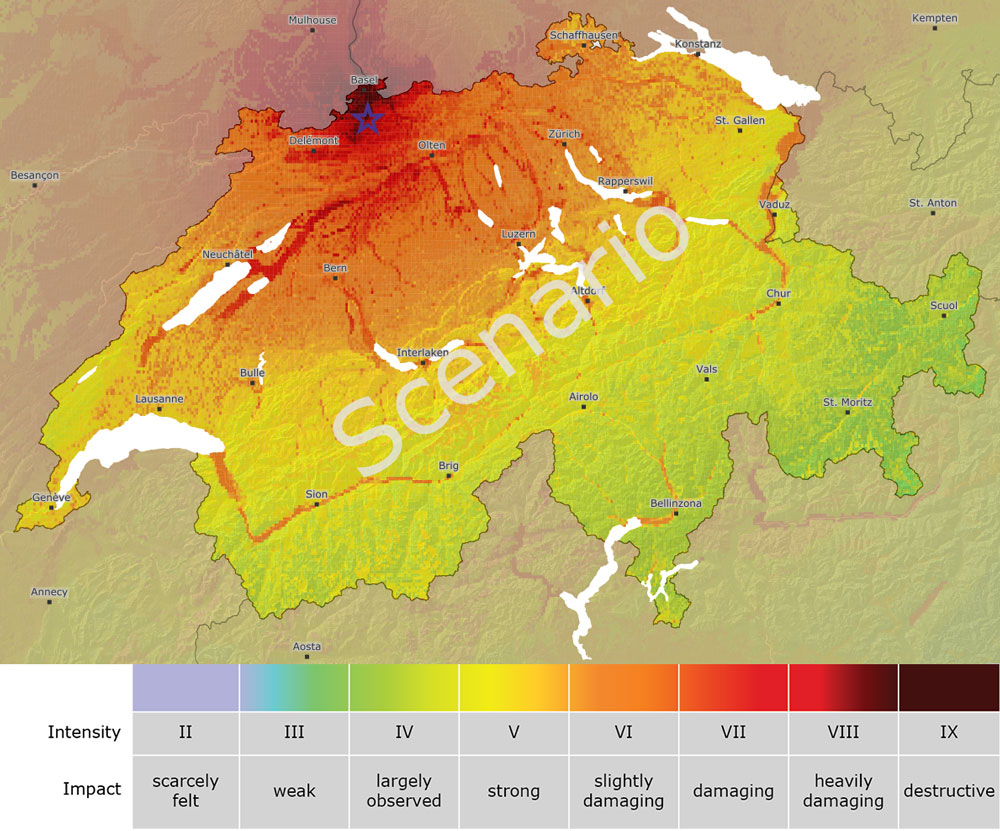
The ShakeMap for the scenario earthquake near Basel with a magnitude of 6.6 is shown below. A similar earthquake occurred at the same location on October 18, 1356, resulting in enormous damage. On average, a comparable earthquake can be expected in the Basel region every 1,500 to 2,500 years. The star denotes the epicenter of the earthquake. The colors indicate how strong the ground shaking would be at certain locations and what possible damage would result.
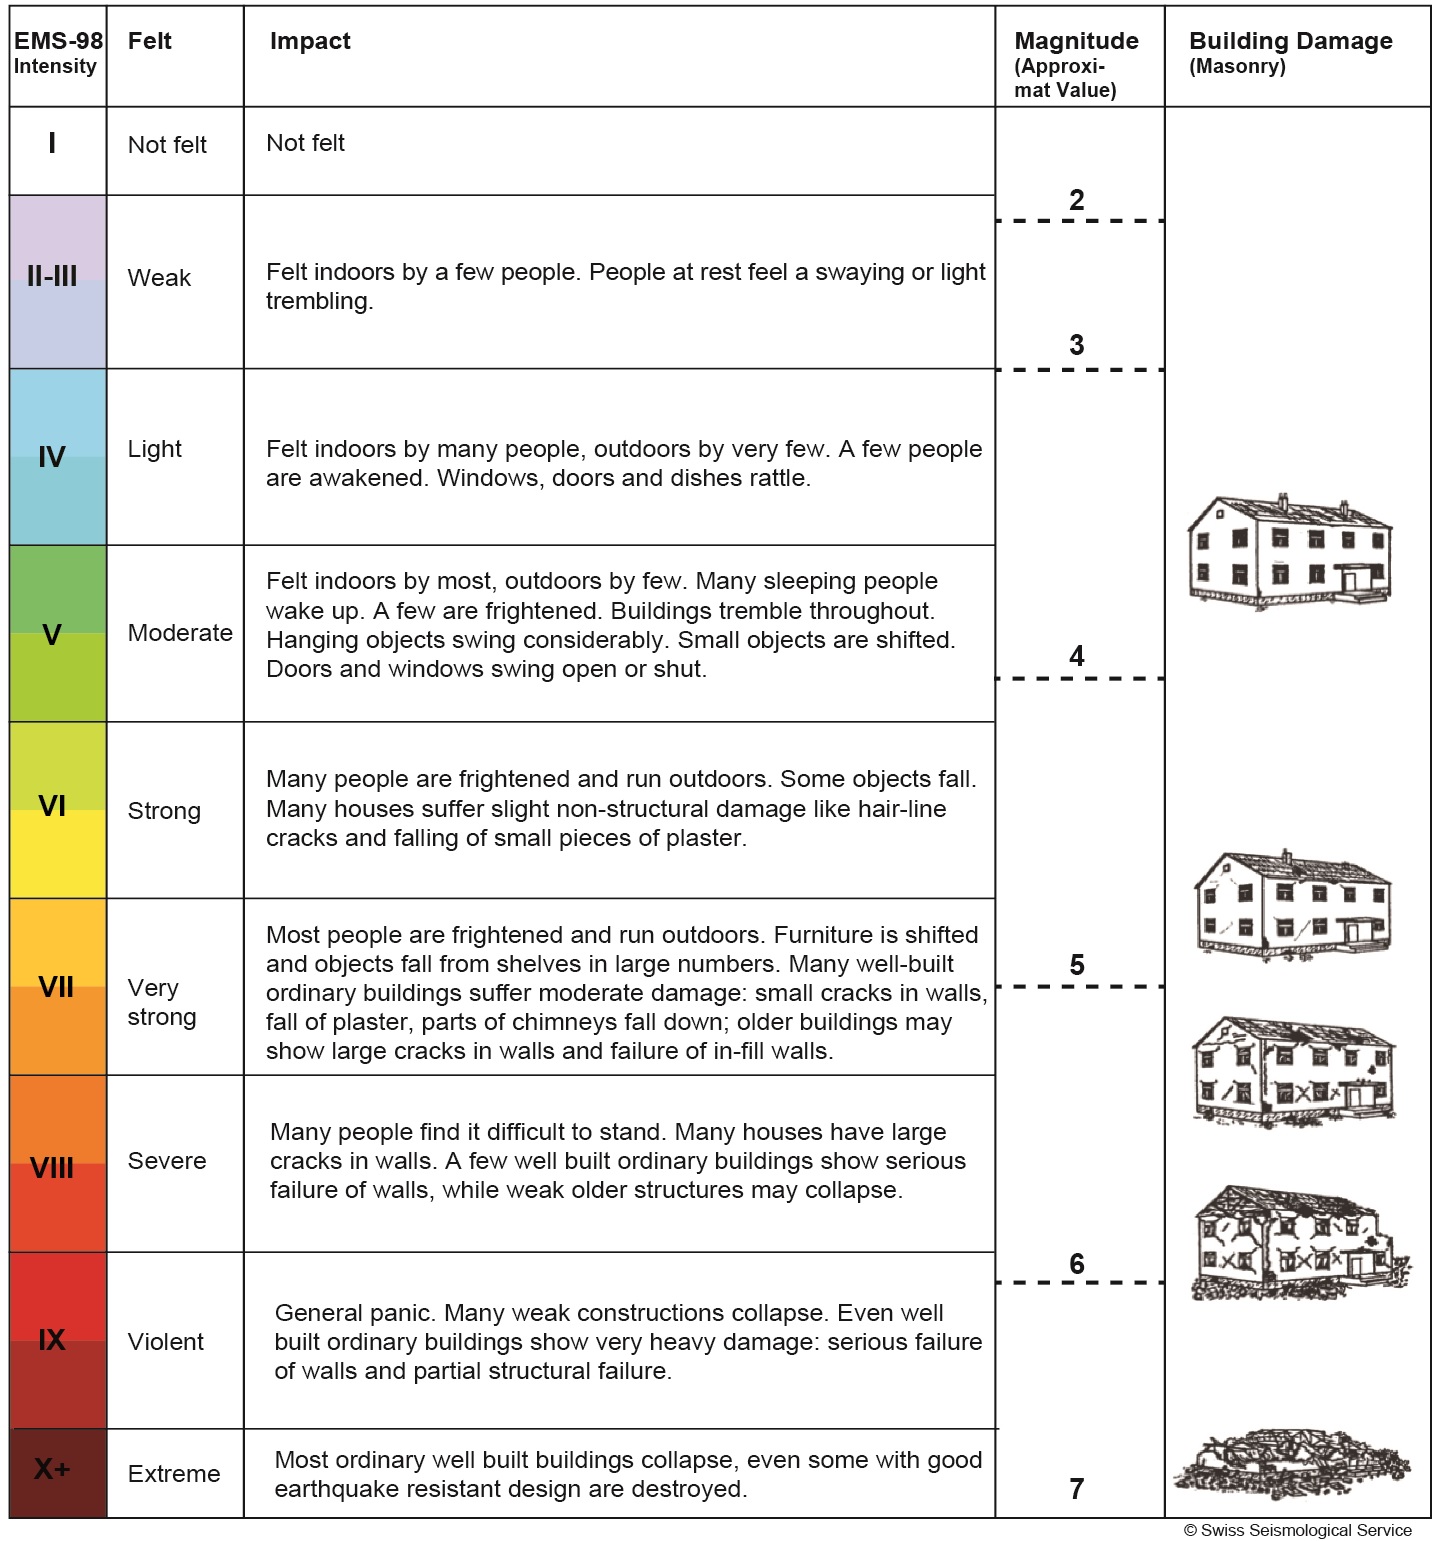
The colors used in the ShakeMap are derived from the European Macroseismic Scale (EMS-98), which is used as a measure for comparing the impact of earthquakes across Europe. This scenario earthquake would reach an intensity of IX near the epicenter and cause destructive damage as well as panic among the local population.
ShakeMap earthquake scenario Basel, magnitude 6.6
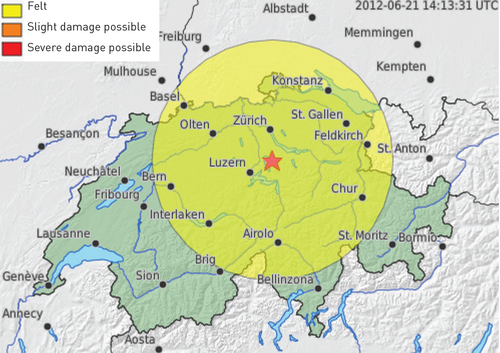
A map of ground shaking is created prior to the creation of the ShakeMap for every earthquake with a magnitude of 2.5 or greater. The colored circle on the map of ground shaking shown below from the 2012 Zug earthquake indicates the regions in which the earthquake was likely felt (yellow). The map of ground shaking is a simplified form of a ShakeMap and it may be produced faster than ShakeMaps. It indicates the area around the epicenter in which the earthquake is presumed to have been felt and suggests an initial damage estimate. Unlike the ShakeMap, the map of ground shaking takes neither the effects of the local subsurface nor the ground shaking actually measured by seismometers into account. It is based solely on the automatic earthquake location and the magnitude. The expected ground shaking is based on observations from past earthquakes in Switzerland.
Map of ground shaking of the earthquake in Zug on February 11, 2012 at 23:45 with a magnitude of 4.2.
Note: ShakeMaps are generated automatically following moderate and large earthquakes. These are preliminary ground shaking maps, normally published within several minutes of the earthquake origin time. They are, at least initially, NOT checked by humans. Further, since ground motions and intensities typically can vary significantly over small distances, these maps are only approximate. At small scales, they should be considered unreliable. Finally, the input data is raw and unchecked, and may contain errors.
